


REPORTS AND ANALYTICS
No more collecting branch figures by hand: reports show peak hours, waiting time and every operator’s work on their own — and arrive by e-mail or Telegram on a schedule.
Reports by operator, service, branch, waiting and service time, customer ratings, hour and day. Charts, filters by period, branch, operator and service. Export to Excel, PDF and CSV.
What changes
Desks are open when customers come
Tickets by hour and day show peaks and quiet hours — you plan shifts and breaks by the numbers.
You see who works how
For every operator: how many customers they served, how many didn’t show up, redirects and customer ratings.
No need to compile the report
On a schedule — by e-mail or Telegram. Figures from all branches are already combined.
What reports there are
Reports are built with filters: period, branch, operator, service.
How many customers each one served, how many didn’t show up, who was redirected.
How many tickets were issued and served for each service.
Average time; how many customers waited under 15 minutes, 15–30, 30–45 and longer.
How customers rated the service: each rating is linked to the ticket and operator.
Compare branches; each one expands into services.
When customers come: peaks and quiet hours.
There are others too — for example, by ticket type and by the languages customers choose.
This is how reports look in the dashboard
Dashboard screens with demo data.
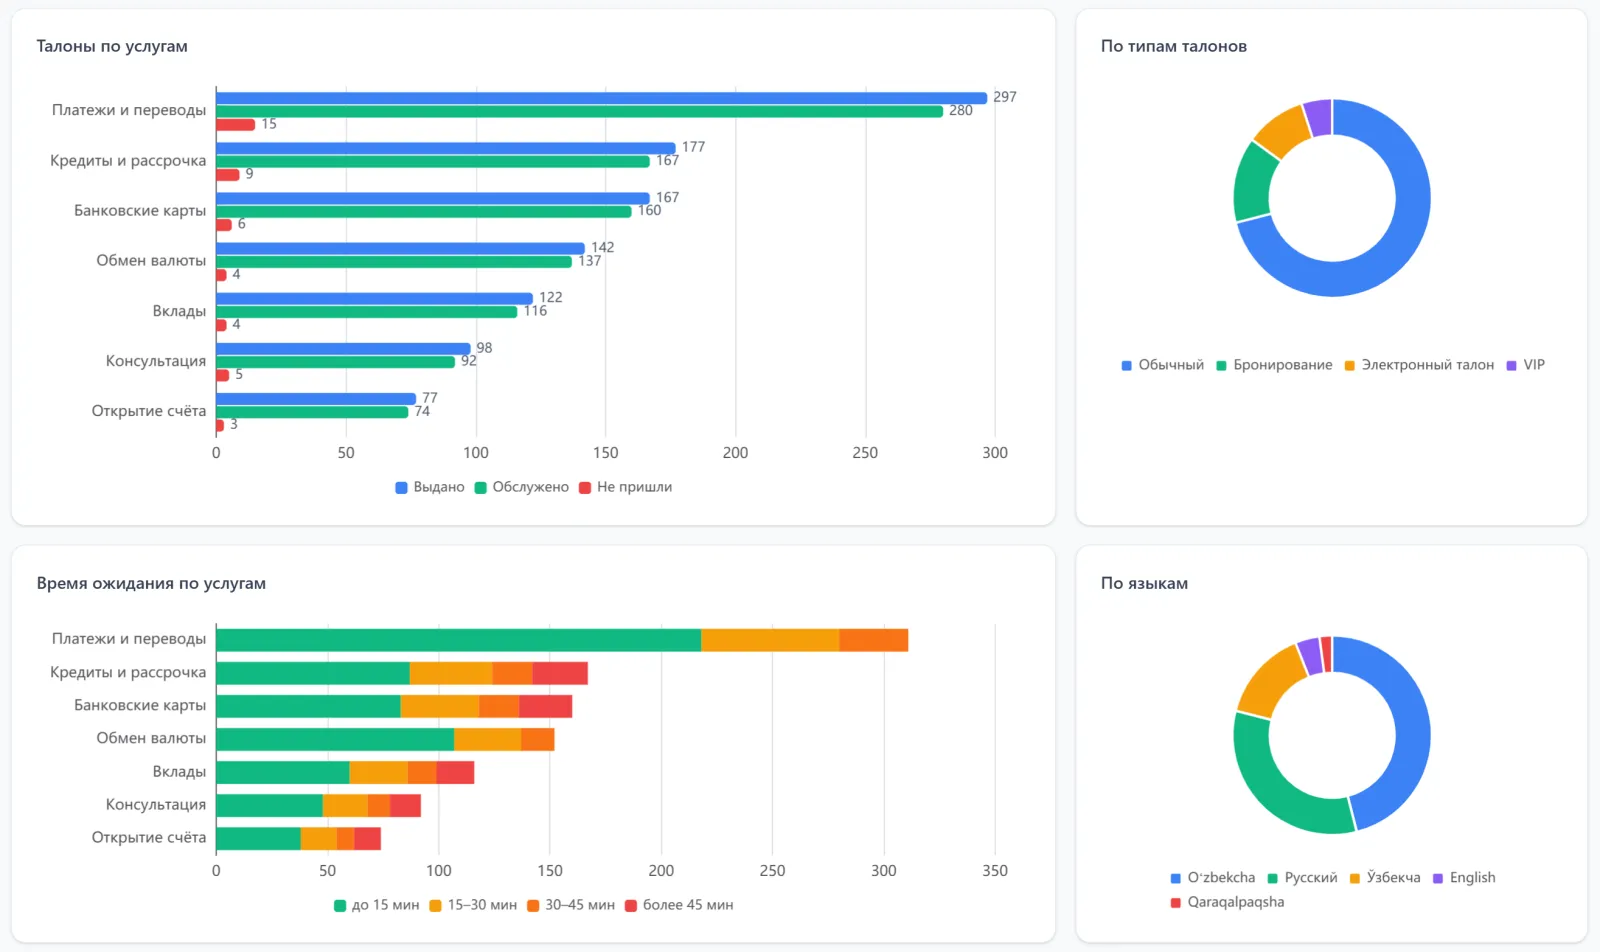
| No. | What it shows |
|---|---|
| 1 | Tickets for every service: issued, served, no-shows |
| 2 | Ticket types: regular, booked, e-ticket, VIP |
| 3 | Waiting time by service: under 15 minutes, 15–30, 30–45, over 45 |
| 4 | Languages customers choose |
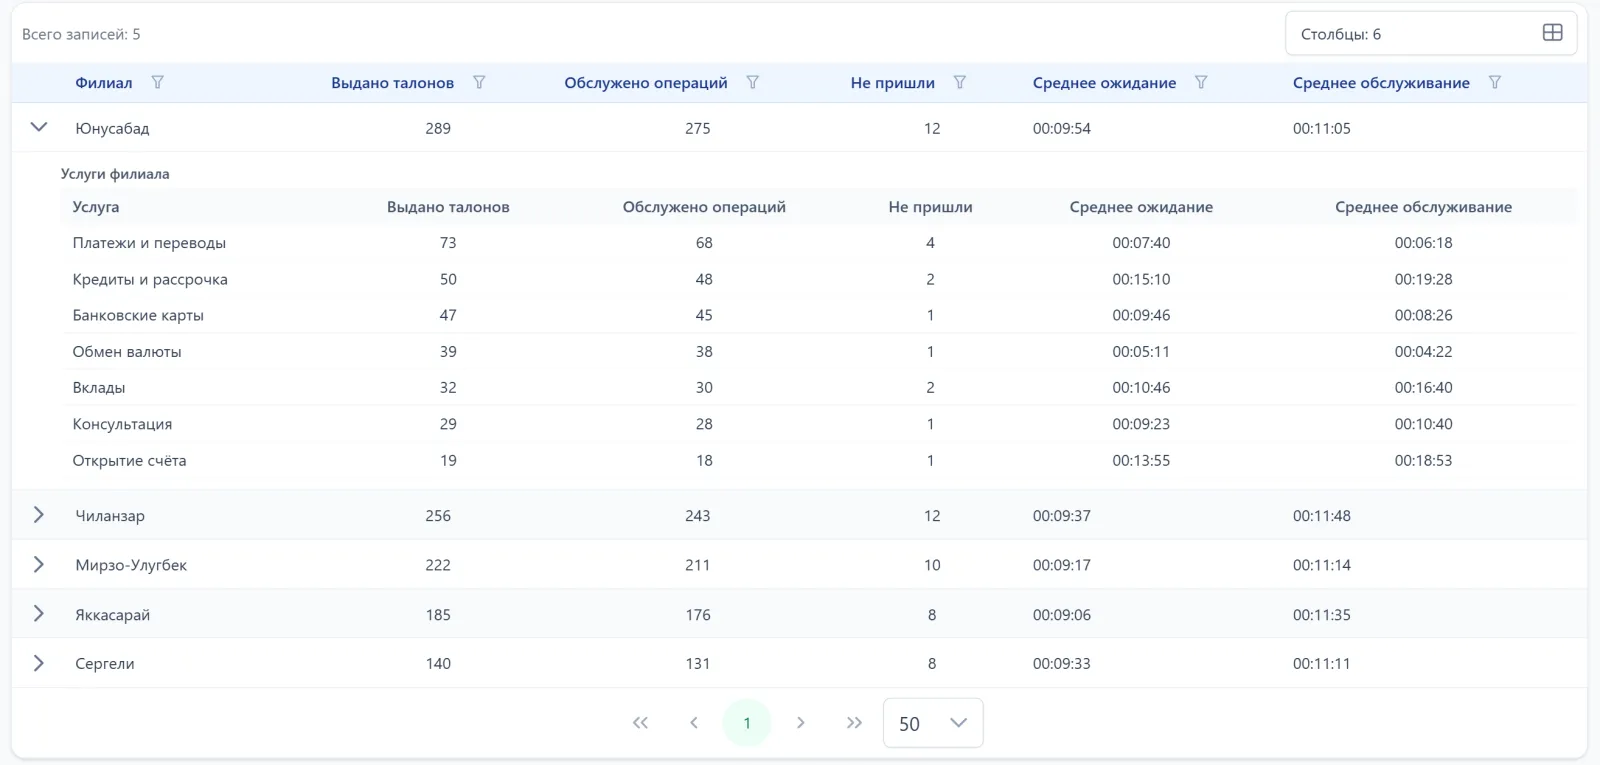
| No. | What it shows |
|---|---|
| 1 | Issued, served and how many didn’t show up |
| 2 | Average waiting and service time: see where people wait longer |
| A | Each branch expands into its services |
Filters, export and delivery
Pick the slice you need, download a file or get the report on a schedule.
Period, branch, operator, service — plus additional filters.
- Period
- Branch
- Operator
- Service
A report as a file — for accounting, management or your own spreadsheet.
- Excel
- CSV
The report arrives by e-mail or Telegram by itself — every Monday, for example.
- Telegram
Who sees what
Everyone sees their own part of the network.
| Option | Reports and analytics |
|---|---|
| Local | Works |
| Mixed | Works; if the internet drops, tickets still print and the data reaches reports once the connection is back |
| Online | Works |
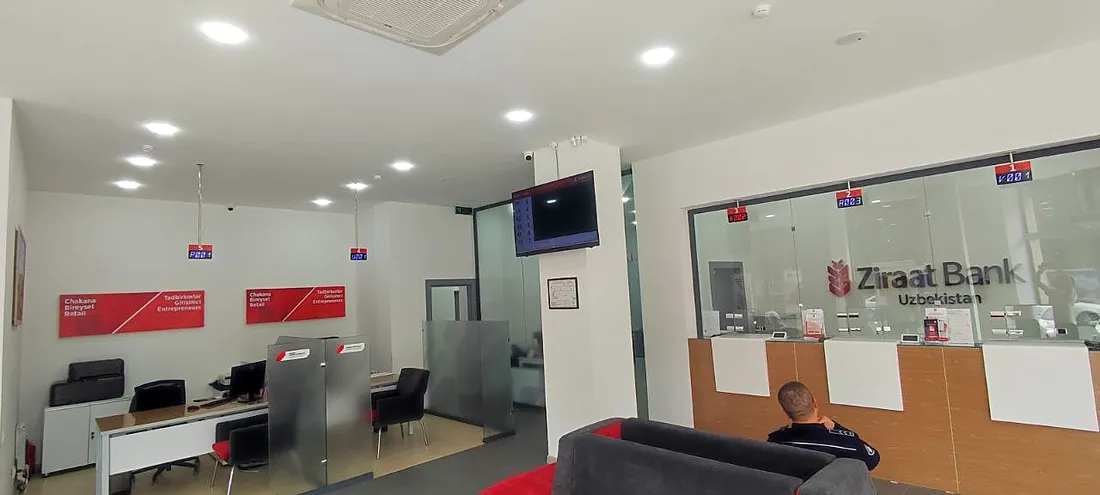
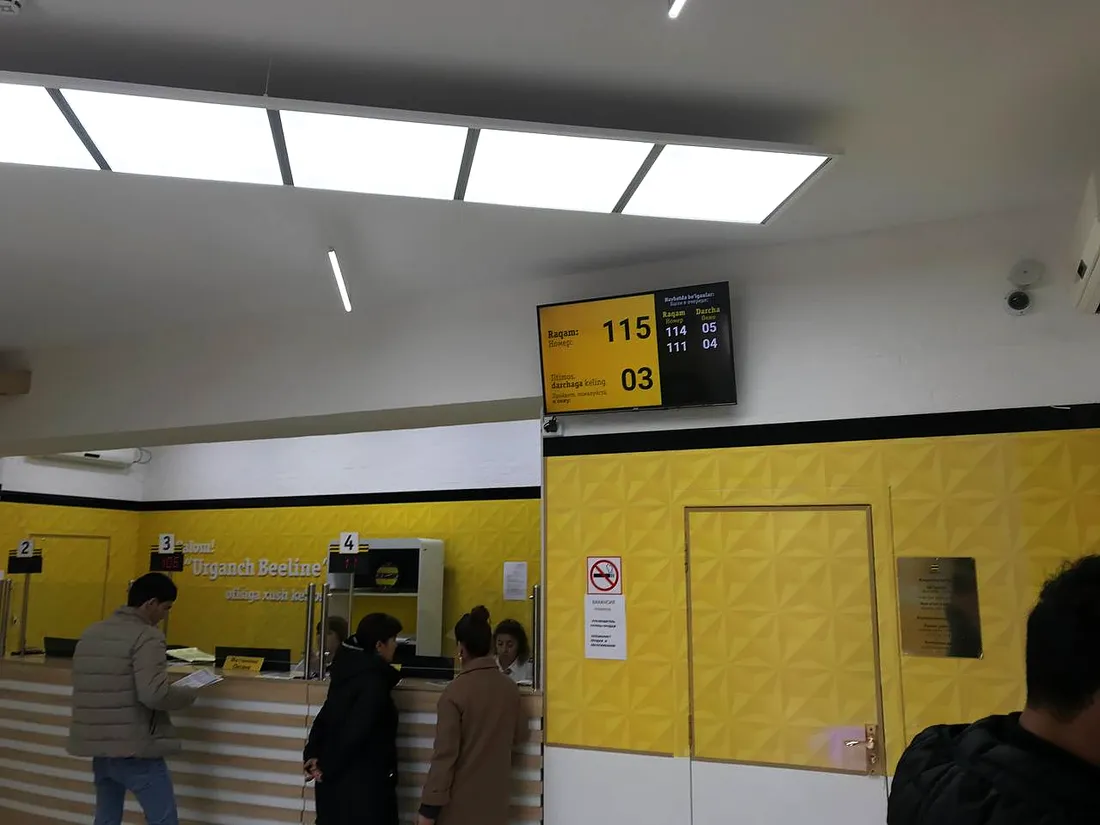
Where our queue system already works
Banks, medical centres, universities and telecom operators all over Uzbekistan.

What reports work with
Frequently asked questions
What reports are there?
By operator, service, branch, waiting and service time, customer ratings, hour and day — and others, for example by ticket type and language.
Are there charts?
Yes: tickets by day and hour, waiting time, tickets by service and branch, ticket types, languages.
What formats can a report be exported to?
Excel, PDF and CSV.
Can reports be received automatically?
Yes, on a schedule — by e-mail or Telegram.
What filters are there?
Period, branch, operator, service and additional filters.
Who sees the reports?
The network head sees all branches; a branch head sees only their own.
Are customer ratings visible in reports?
Yes. Each rating is linked to the ticket and operator.
Can I listen to a conversation from a report?
Yes, if Service recording is connected — in the Local and Mixed options.
Which options do reports work in?
All three: Local, Mixed and Online.
We’ll show reports for your network
Tell us how many branches and desks you have — we’ll show reports in a demo and send a quote.